
When Should You Source Expert Help For Scientific Charts?
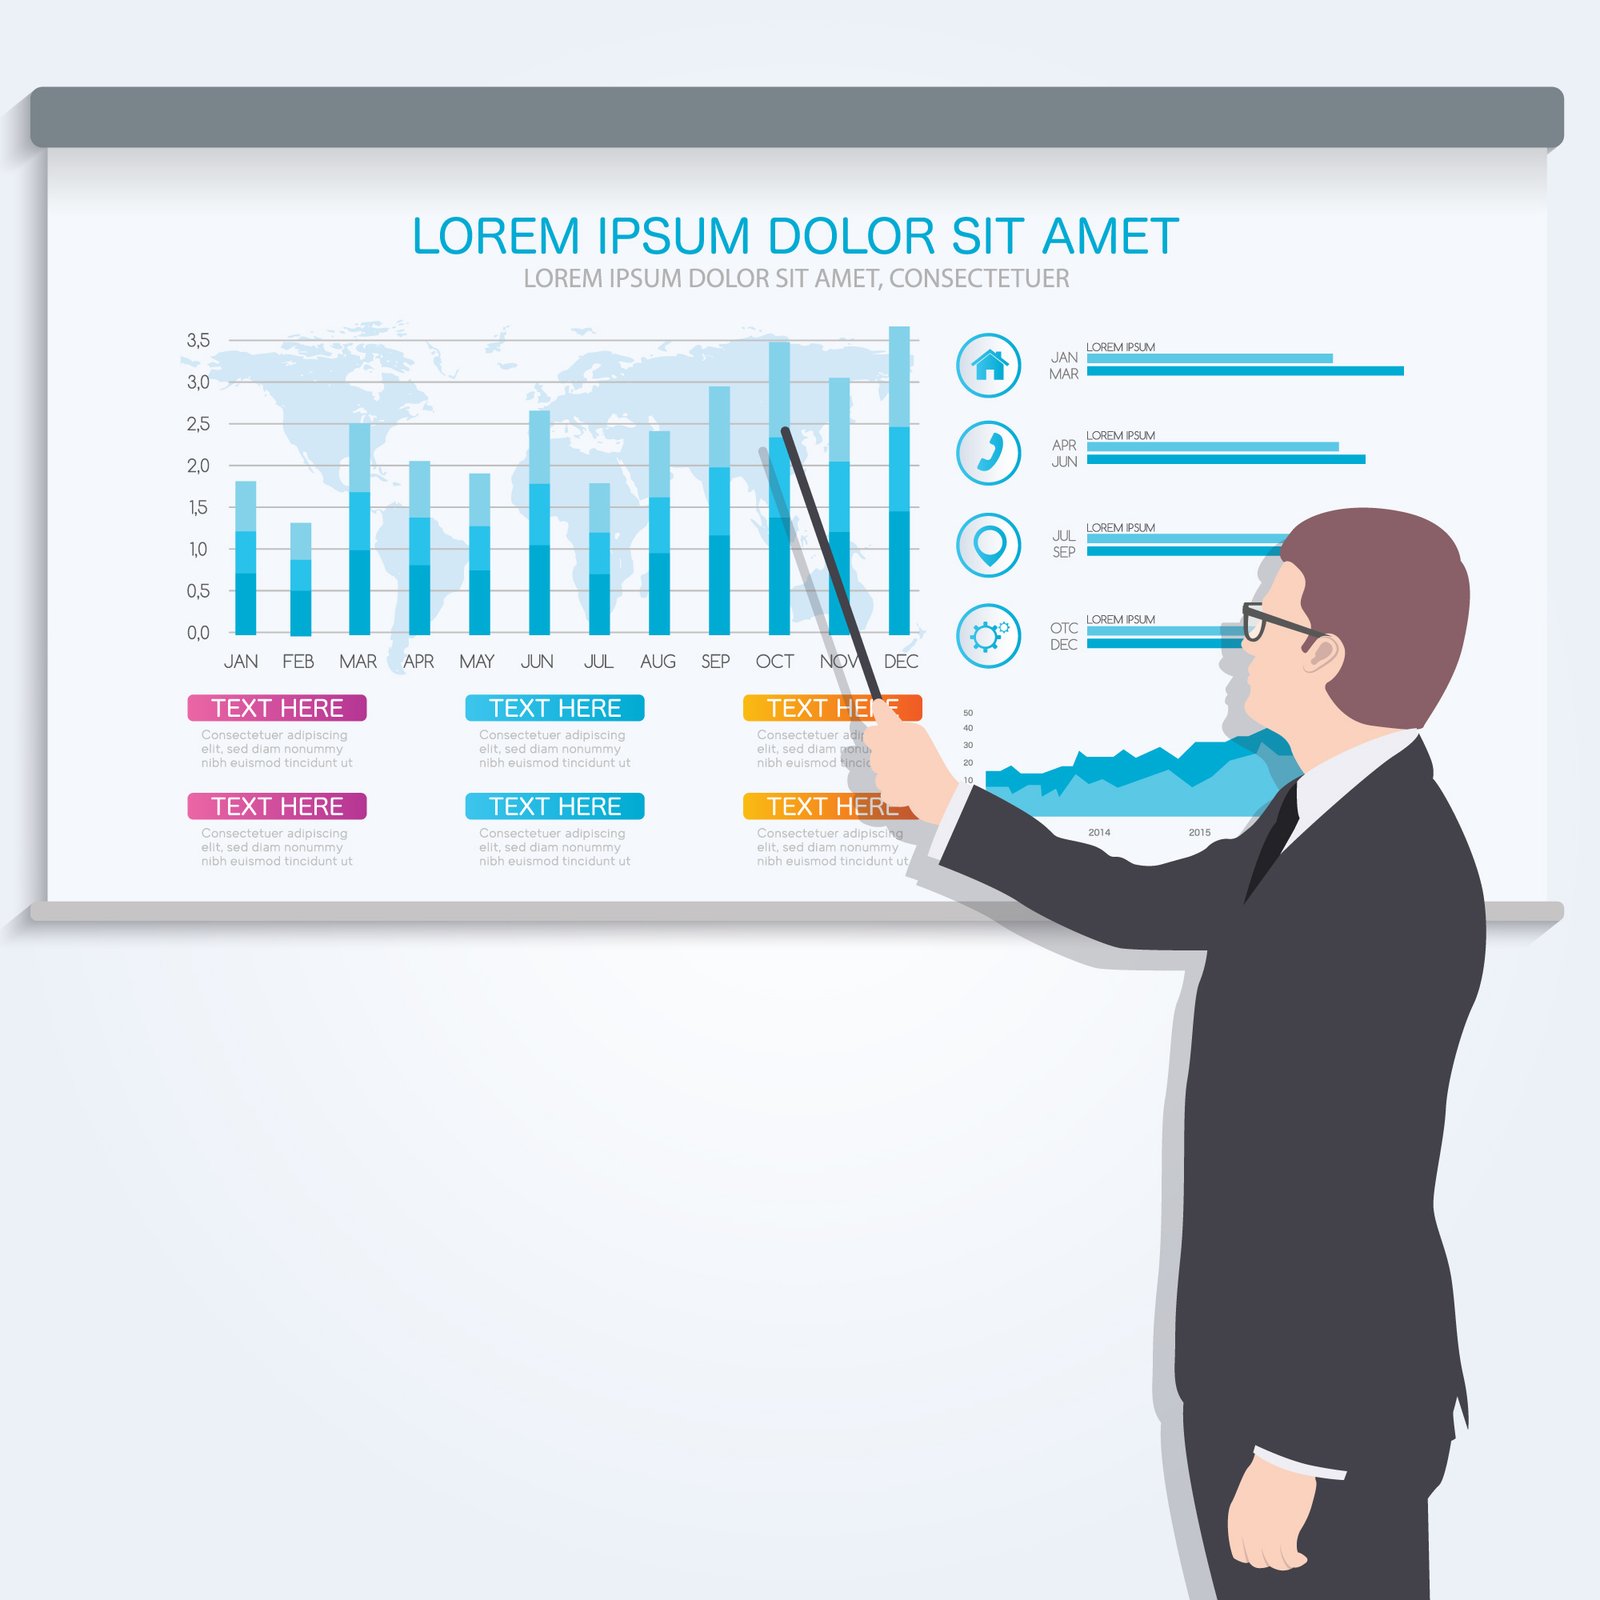
Have you ever struggled to recreate a scientific chart design in PowerPoint? Whilst they may seem simple to create, they can be extremely detailed to put together. You may find there are multiple data points, small text, different colours, technical symbols and sections which all need to be positioned correctly.
This is commonly seen in research teams, businesses, consultant and corporate professionals. Due to the level of detail, recreating scientific charts can take up a lot of time. Especially if you only have access to a screenshot or PDF.
However, should you try to recreate them manually or source expert help? Let’s look at when you should source expert help.
1. Your Chart Is Too Complicated
Some scientific charts can be easily created. You can recreate basic bar or pie charts quickly.
However, what if your chart has multiple graphs, overlapping lines and detailed data?
This can become very complicated.
For example, in a research team you may need to recreate a scientific figure with multiple charts. This could take hours to recreate as you need to ensure the spacing, labelling, colours and data are accurate.
This is where expert help can assist. They will know how to deconstruct complex charts and recreate them accurately.
2. You Can’t Risk Any Data Errors
Have you noticed how small changes can impact the meaning of a scientific chart?
If any data is incorrect, missing or the axis are incorrect, you can cause confusion for the reader. This is crucial in sectors such as medical research, engineering, pharma and technical presentations.
When recreating charts, expert designers will ensure the detail is accurate. They will ensure your new chart design matches the original reference. And that all key details are included.
Your chart design will look great but also convey the correct information.
3. You Only Have Access To A Screenshot Or PDF
One of the most common issues faced by businesses.
You may have a chart from a research paper or old presentation but you don’t have the original editable version.
Trying to recreate the chart manually can take a long time. Especially if the charts are complicated. Experts can recreate your charts from the reference you have. They can recreate your charts in PowerPoint or other appropriate formats.
They can recreate:
- Scientific charts from a screenshot.
- Research charts from a PDF.
- Technical diagrams from scanned documents.
- Multiple charts from research papers.
- Old presentation charts.
Depending on how complicated the chart is, they can create an editable version.
4. Your Internal Team Lack Experience
Whilst your employees may excel in research, data analysis or business presentations, they may not have the time or expertise to recreate complicated scientific charts.
Outsourcing to a Presentation Design Firm can make this easier.
Rather than asking your research or marketing team to spend hours editing your charts, you can ask an expert designer to recreate them.
MyBusiness Visual can help your business or professionals with presentation design and complex chart recreation. The team focus on simplifying technical information without losing the meaning.
5. You Are On A Tight Deadline
Say you have an important client presentation in a weeks time. You still have 15 scientific charts to recreate.
You probably wouldn’t ask your internal team to do this.
If you are on a tight deadline you can outsource. Experts can recreate multiple charts and keep your designs consistent. This will help you complete your presentation on time.
This is perfect for research organisations, consulting firms, universities and corporate teams.
6. You Need Editable Charts
Sometimes charts aren’t just for one presentation. You may need to update the charts monthly or use them across different reports.
This means you may not want to have an image file.
You would need an editable chart so you can edit the labelling, colours, values etc.
Ex McKinsey Presentation Specialist will know the importance of having a clean layout, consistency and easy to update presentation elements.
MyBusiness Visual can help you create organised presentation charts.
DIY Vs Expert Help
| DIY | Expert Help |
|---|---|
| Time: Can take several hours | Time: More organised process |
| Complicated charts: Hard to manage | Complicated charts: Experienced designers will manage |
| Data detail: Easy to miss | Data detail: Structured process |
| Consistency: Design depends on your skills | Consistency: Consistent presentation style |
| Multiple charts: More work for you | Multiple charts: Easier to manage in batches |
| Editable: Can be difficult to create | Editable: Can be planned from the start |
What To Consider In Modern Scientific Charts?
Scientific presentations are evolving. You shouldn’t just have numbers in a chart but ensure your audience can understand your information easily.
Consider:
- Simple colours – Use colours so it’s easy to distinguish between data points.
- Easy to read – Don’t use small text or crowded legends.
- Appropriate charts – Use bar charts, line graphs, scatter charts etc, depending on your data.
- Clean – Keep your charts clean and avoid any unnecessary elements.
- Editable – Where possible make them editable for future changes.
AI tools are now being used in presentations. They can help create your initial visualisations but it’s important to have a human review your technical/scientific information.
FAQs
Can scientific charts be recreated from images?
Yes! Charts can be recreated from screenshots, photos and PDFs. However, if you have the original data then accuracy can be improved.
How long does it take to recreate scientific charts?
This depends on how many charts you have and how complicated they are. A simple chart can be quicker to recreate but detailed scientific charts can take several hours.
Can I have scientific charts in editable Powerpoint?
Yes! Many charts can be recreated using editable powerpoint elements.
Is it costly to outsource scientific chart recreation?
This depends on how complicated the charts are, how many you have and how you want them delivered. If your internal team would be spending a lot of hours on this then outsourcing can be a cost effective option.
Who needs professional scientific chart recreation?
Research teams, Universities, Pharma companies, Engineering businesses, Consultants and Corporate professionals often need this service.
Final Thoughts
Not all charts will need professional help. Simple charts can be easily created in Powerpoint or Excel.
However, if you have complicated scientific charts, multiple charts, low quality reference charts or tight deadlines, then sourcing expert help can help you save a lot of time.
MyBusiness Visual can help your business or research professionals create clear and organised charts from complex charts.
Sometimes the best choice is to not spend extra hours doing it all yourself and ask the right experts.